For years now, AMD barely mattered in the laptop space, and even if their platforms have improved in recent years, they’ve only been the lower-tier budget alternatives for the Intel Core H platforms.
Not anymore, though. As of Spring 2020, Ryzen 4000 Mobile platforms are available in stores and boy they change everything.
This article is a review of the Ryzen 7 4800H platform, the mid-range APU that replaces last year’s Ryzen 7 3750H and competes with the Intel 9th and 10th gen Core H i7s in performance notebooks.
We’re not going to get much in-depth on the specs and particularities, you’ll find them on AMD’s site and in the quick sheet down below. Instead, we’ll focus on benchmarks results, have a look at how this platform performs in demanding loads and in games when paired with mid-range RTX 2060 graphics, as well as how it handles daily use in terms of thermals and efficiency.
That aside, we’ll also pitch this against the lower-tier Ryzen 5 4600H processor and the previous Ryzen 7 3750H. We’ve left the AMDF HS and the Intel options out of this, as we’re covering those in separate articles that should be available on the site shortly.
Ok, so first off, the specs sheet for the Ryzen 7 4800H APU.
| Ryzen 7 4800H | Ryzen 7 4800HS | Ryzen 5 4600H | Ryzen 7 3750H | |
| Build process | 7 nm | 14 nm | ||
| Generation | Zen 2 | Zen 1 | ||
| TDP | 45 W | 35 W | 45 W | 35 W |
| Cores/Threads | 8/16 | 8/16 | 6/12 | 4/8 |
| CPU Base Frequency | 2.9 GHz | 2.9 GHz | 3.0 GHz | 2.3 GHz |
| CPU Max Turbo | 4.2 GHz | 4.2 GHz | 4.0 GHz | 4.0 GHz |
| L3 Cache | 8 MB | 4 MB | ||
| Memory Type |
DDR4 3200 MHz, LPDDR4X 4266 MHz | DDR4 2400 MHz | ||
| Graphics | Radeon Vega, 8 CUs | Radeon Vega, 7 CUs | Radeon Vega, 6 CUs | Radeon RX Vega 10 |
| Graphics Speed | up to 1600 MHz | up to 1600 MHz | up to 1500 MHz | up to 1400 MHz |
| Processing Power | 1.43 TFLOPs | 1.43 TFLOPs | 1.15 TFLOPs | – |
The updated Zen2 Ryzen 4000 platforms offer not just a significant increase in core/thread count over the Ryzen 7 3750H, but also improved IPC and multiple other various optimizations, as well as a more powerful Vega iGPU implementation. That’s not going to matter much though, as Ryzen H APUs are always bundled with some sort of dedicated GPU that will handle the demanding graphics loads instead.
As far as the performance goes, let’s jump straight into the demanding CPU loads. We ran tests on two different Ryzen 7 4800H notebooks from Asus (the TUF Gaming A15 and A17 variants), which offer a Turbo power profile that increases the CPU’s power allocation in demanding loads. That’s similar for Intel platforms, just keep in mind that not all notebook are created equally, and some might not be as generous.
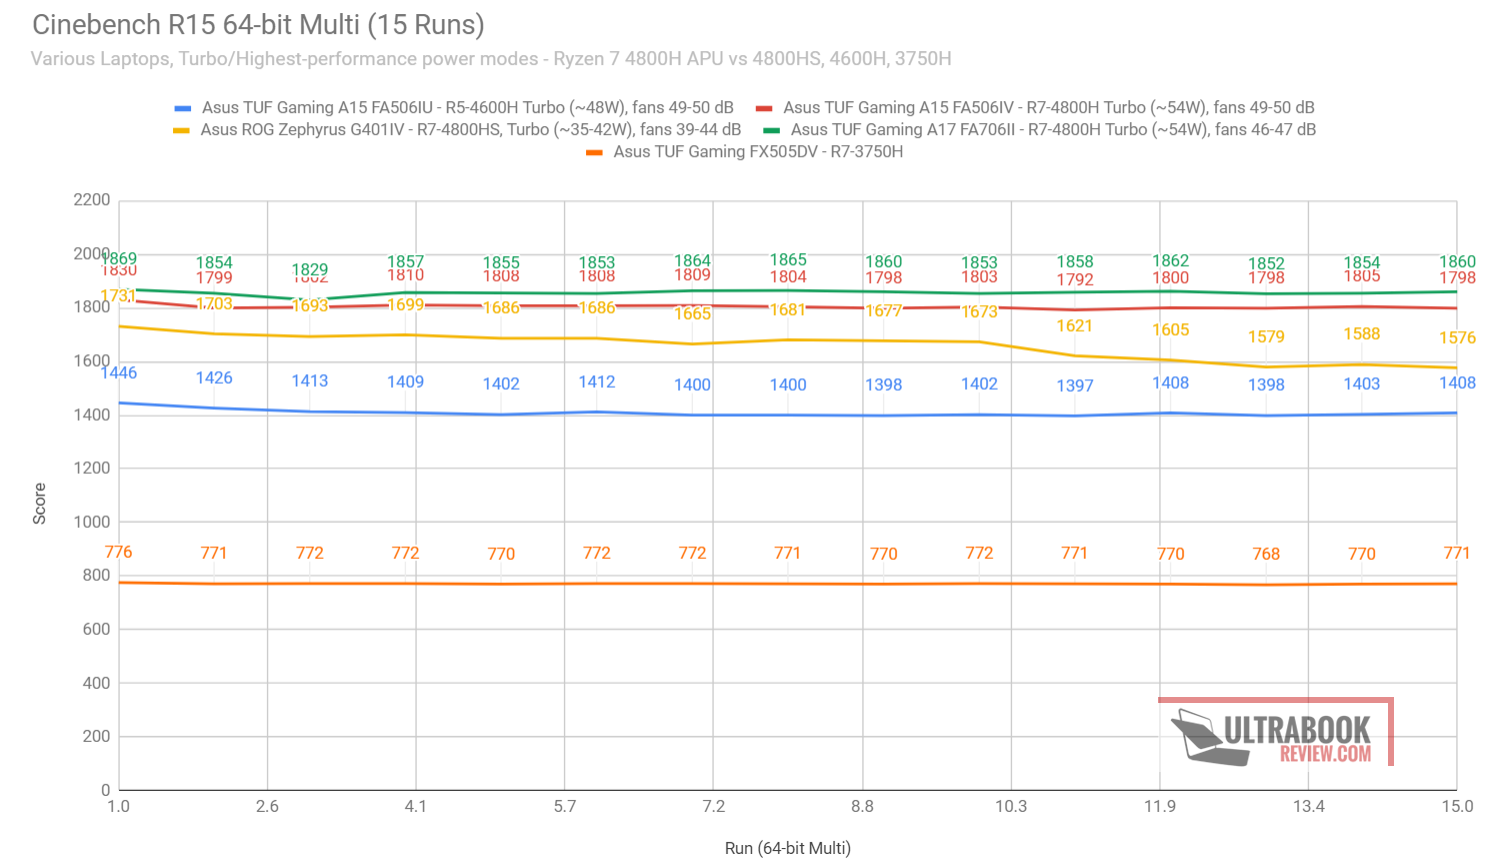
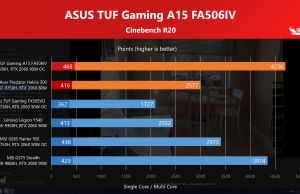
For the first test, we’re running Cinebench R15 for 15+ loops on these Turbo profiles, which set a TDP of 54W for these Ryzen 7 4800H. That’s allowing them to run at higher clocks than on a standard 45W implementation.
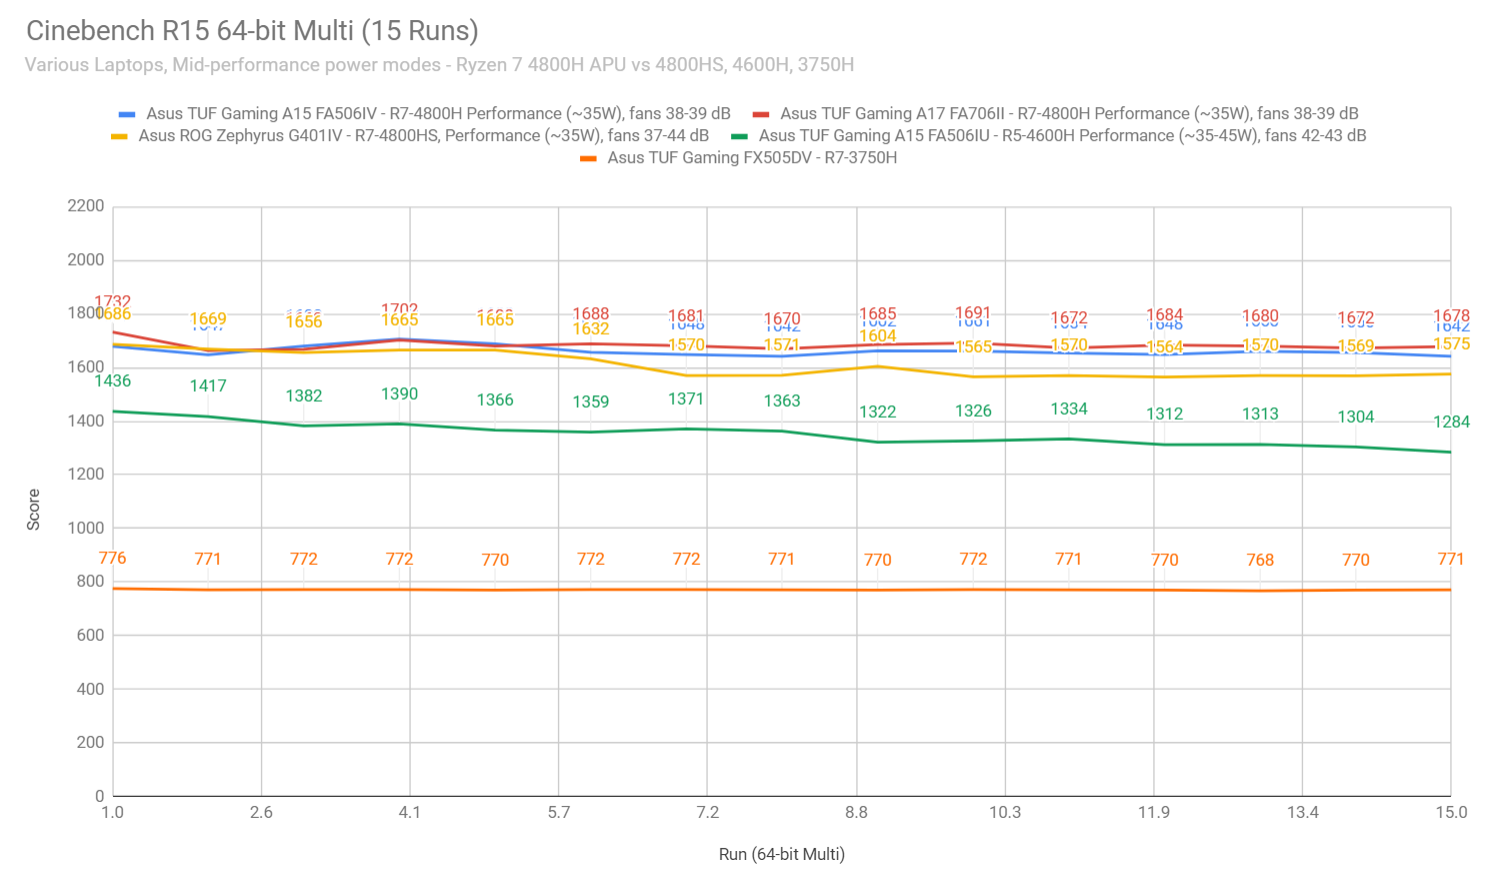
However, Asus also offers a Performance profile that tames down the fans and sets a lower 35W TDP, and we’ve included these results down below as well. The two scenarios paint a general picture of what to expect from various implementations on this Ryzen 7 4800H platform.
And here’s a quick comparison between these several AMD platforms. These results are based on the Ryzen 7 4800HS in the Asus ROG Zephyrus G14, the Ryzen 5 4600H in the Asus TUF Gaming A15 FA506IU (review available soon), and the Ryzen 7 3750H results on the Asus TUF Gaming FX505. We haven’t properly logged our findings for the Cinebench R20 tests on the 35W 4800H implementation, so we’ll update that in a future article.
| Ryzen 7 4800H (FA506) | Ryzen 7 4800H (FA706) | Ryzen 7 4800HS (GA401) | Ryzen 5 4600H (FA506) | Ryzen 7 3750H (FX505) | |
| Cinebench R15 CPU – 54W | 1846 cb | 1869 cb | 1731 cb | 1446 cb | 776 cb |
| Cinebench R15 Single Core – 54W | 188 cb | 188 cb | 188 cb | 177 cb | 153 cb |
| Cinebench R15 CPU – 35W | 1645 cb | 1678 cb | 1570 cb | 1325 cb | 776 cb |
| Cinebench R20 CPU – 54W | 4236 cb | 4249 cb | 3928 cb | 3245 cb | 1727 cb |
| Cinebench R20 Single Core – 54W | 468 cb | 481 cb | 478 cb | 449 cb | 362 cb |
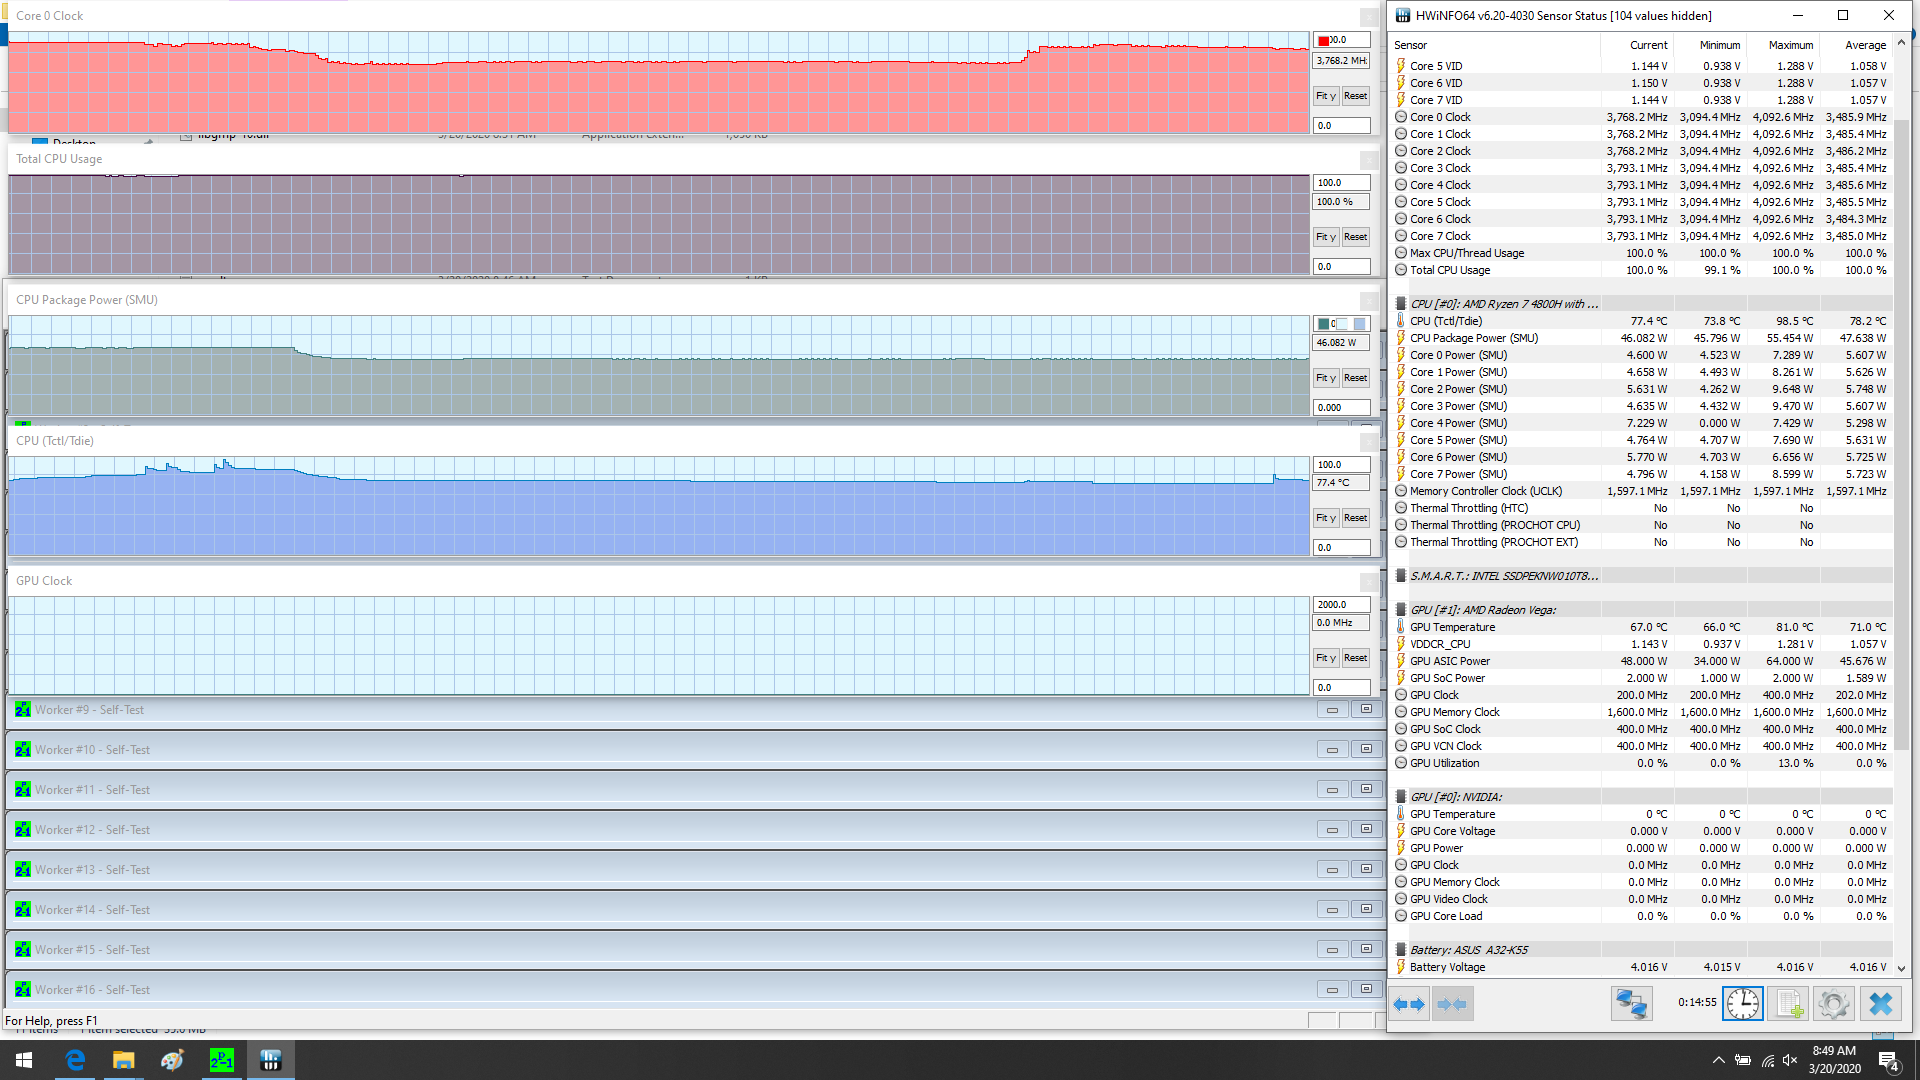
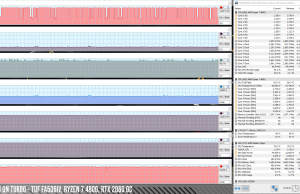
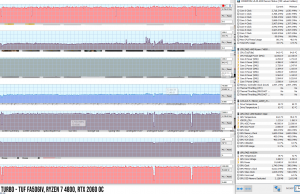
We also ran Prime95 on the 4800H configurations in order to show how the CPU deals with longer 100% loads. In both implementations the Ryzen 7 4800H kicks in hard, at around 54 W, but then settles at 45W after a few minutes, with slight frequency and temperature variations. The log below also shows what to expect in terms of temperatures, although that’s not really relevant in this sort of scenario, but rather in combined CPU and GPU chores. We’ll get to those further down.
This aside, we also ran a few other benchmarks on the various configurations, including GeekBench and 3DMark, as well as Blender, Handbrake video encoding and x265 Bench decoding. All these tests are running on the Turbo/Highest-performance settings.
| Ryzen 7 4800H (FA506) | Ryzen 7 4800H (FA706) | Ryzen 7 4800HS (GA401) | Ryzen 5 4600H (FA506) | Ryzen 7 3750H (FX505) | |
| 3DMark – Fire Strike Physics | 22207 | 22320 | 20984 | 18378 | 11436 |
| 3DMark – Time Spy CPU | 9126 | 9533 | 8236 | 6792 | 3293 |
| Blender – BMW Scene, CPU | 3m 35s | 3m 18s | 3m 44s | 4m 32s | – |
| Blender – Classroom Scene, CPU | 11m 15s | 10m 21s | 11m 32s | 14m 32s | – |
| Geekbench 4 64-bit – Multi-Core | 30945 | 31614 | 29334 | 25955 | 13239 |
| Geekbench 5 64-bit – Multi-Core | 8294 | 8370 | 7701 | 6763 | 3660 |
| Geekbench 5 64-bit – Single Core | 1195 | 1198 | 1195 | 1117 | 974 |
| HandBrake 4K > 1080p encoding | 43.48 fps | 44.65 fps | 41.79 fps | 40.18 fps | – |
| PassMark CPU | 20835 | 20950 | 19686 | 17170 | 9766 |
| PCMark 10 – Productivity | 7443 | 7245 | 7411 | 6999 | 6076 |
| PCMark 10 – Digital Content Creation | 6598 | 6101 | 6558 | 5866 | 4667 |
| x265 HD Benchmark | 33.48 fps | 32.68 fps | 35.58s | 41.02s | 74.76s |
A couple of things to take out of these results:
- First off, the 4800H implementation in the larger 17-inch TUF Gaming A17 scores a little bit higher in demanding CPU loads than the sample processor in the smaller 15-inch FA506.
- The efficient 4800HS version holds its way excellently in most Single-Core tests, as scores within 10% of the full-power 4800H in multi-threaded loads. that’s excellent considering it runs at significantly less power.
- The Ryzen 5 4600H scores at about 75% of what the Ryzen 7 in multi-core loads, and the differences get smaller in tasks such as video encoding/decoding or in the Productivity/Content Creation loads.
- Keep in mind that PCMark 10 scores are influenced by the entire configuration, RAM, SSD and GPU.
- Finally, the older Ryzen 7 3750H is outperformed across the board. The Ryzen 5 4600H offers roughly twice the performance, and the Ryzen 7 offers 2.5x results in most multi-threaded tests, with significant gains in single-core tests as well.
Finally, we should also talk about the gaming experience and thermals. These will vastly vary between implementations, based on graphics and thermal implementations available in each product. However, the fact that we’re comparing fairly similar Asus notebooks helps here.
We’ve added some results down below. Keep in mind we’re looking at the following configurations, and all the games are running on the Turbo profiles and FHD resolution:
- Asus TUF Gaming FA506IV – Ryzen 7 4800H CPU, RTX 2060 90W OC, 32 GB RAM, 1 TB SSD
- Asus TUF Gaming FA506IU – Ryzen 5 4600H CPU, GTX 1660Ti 80W OC, 32 GB RAM, 1 TB SSD
- Asus Zephyrus G14 GA401IV – Ryzen 7 4800HS CPU, RTX 2060 65W OC, 16 GB RAM, 1 TB SSD
- Asus TUF Gaming FX505DV – Ryzen 7 3750H CPU, RTX 2060 90W OC, 32 GB RAM, 1 TB SSD
| FA506IV | FA506IU | GA401IV | FX505DV | |
| Battlefield V (DX 12, Ultra Preset, Ray-Tracing OFF) | – | – | 74-88 fps | 78-84 fps |
| Far Cry 5 (DX 11, Ultra Preset, SMAA) | 91 fps | 83 fps | 84 fps | 72 fps |
| Middle Earth: Shadow of Mordor (DX 11, Ultra Preset) | 147 fps | 140 fps | – | 138 fps |
| Red Dead Redemption 2 (DX 12, Ultra Optimized, TAA) | 69 fps | 59 fps | 59 fps | – |
| Rise of Tomb Raider (DX 12, Very High Preset, FXAA) | 91 fps | 85 fps | 82 fps | 61 fps |
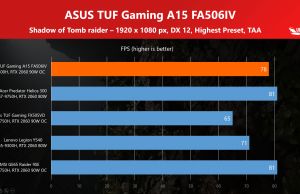
| Shadow of Tomb Raider (DX 12, Highest Preset, TAA) | 78 fps | 73 fps | 70 fps | 65 fps |
| Strange Brigade (Vulkan, Ultra Preset) | 119 fps | 106 fps | 109 fps | – |
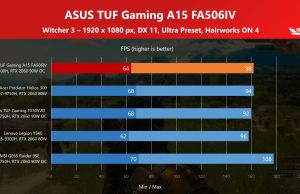
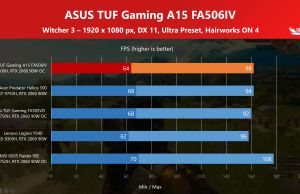
| The Witcher 3: Wild Hunt (DX 11, Ultra Preset, Hairworks On 4) | 64-98 fps | 58-82 fps | 58-90 fps | 68-92 fps |
- The Witcher 3 – recorded with Fraps/in-game FPS counter in campaign mode;
- Far Cry 5, Middle Earth, Strange Brigade, Red Dead Redemption 2, Tomb Raider games – recorded with the included Benchmark utilities;
- Red Dead Redemption 2 Optimized profile based on these settings.
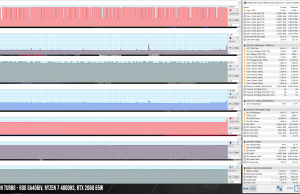
Finally, as far as thermals go, the entire range of Ryzen 7 4000 CPUs hit high temperatures with gaming and complex CPU/GPU loads, in the 85-95 degrees Celsius. Having a lower-tier GPU helps, but not that much, as you can see on the TUF A17 FA706II log.
In conclusion, AMD did a great job with the Ryzen 4000 H platform and the updated generation is a massive improvement of the previous Ryzen lineups. Unfortunately, AMD still needs to win more SKUs, especially in the premium implementations. Right now there are few Ryzen 4000 H laptops out there, and most are mid-tier and lower-end variants with up to RTX 2060 graphics. What I’m looking forward to are higher-tier models with RTX 2080+ graphics, which hopefully will be available later in the year.
That’s about for our review and benchmarks of the Ryzen 7 4800H platform. Let me know what you think about it in the comments section down below, and don’t forget that more details are available in each of our detailed laptop reviews.





Nicolas Jafelle
April 1, 2020 at 5:12 pm
Great comparision!! So, do you say that any of this new chipsets will be hotter than old ryzen 3500u and 3700u? maybe the 4600u will be the sweet spot between thermals, fan noise and performance? Thanks!
Andrei Girbea
April 1, 2020 at 6:10 pm
Wait, U series are different than H series and not included here. Did you mean the 4600H? If yes, that's also 45W. Temperatures are dependant on the power profiles implemented in each laptop, with the TUF Gaming models we've reviewed so far, Asus offers high TDP + High fans or average TDP and average fans, and both end up with hot CPU temperatures. Average TDP + high fans should offer better thermals.