
If you’re buying an all-purpose portable laptop this year, this article will come in handy, as it goes over how some of the better mobile platforms available right now compare in capabilities and efficiency.
That means we’re looking at the AMD Ryzen AI 9 HX 470 platform (AMD Gorgon Point) versus the Intel Core Ultra 9 386H (Intel Panther Lake), as well as versus a few other options from AMD, such as the Ryzen AI 9 Max+ 395, Ryzen AI 9 HX 370, or the Ryzen AI 7 450, just so you can better understand what sets these apart.
The results and findings we’re discussing here are based on our detailed reviews of fairly similar implementations, most of them in the premium segments of jack-of-all-trades notebooks, such as the:
- Lenovo Legion 7a (AMD Ryzen AI 9 HX 470);
- Asus ROG Zephyrus G16 (Intel Core Ultra 9 386H);
- Lenovo Yoga Pro 9i (Intel Core Ultra 9 386H);
- Asus ROG Zephyrus G16 (AMD Ryzen AI 7 HX 370);
- Lenovo Legion 5a (AMD Ryzen AI 7 450).
With that out of the way, let’s get started with the general specs of these platforms. However, keep in mind you can’t draw any real performance conclusions based on these numbers, but they help you understand the general particularities of each platform.
| AMD Ryzen AI 9 HX 470 AMD Gorgon Point |
Intel Core Ultra 9 386H Intel Panther Lake |
AMD Ryzen AI 7 450 AMD Gorgon Point |
AMD Ryzen AI 9 HX 370 AMD Strix Point |
|
| Build process | TSMC 4nm FinFET | Intel 18A | TSMC 4nm FinFET | TSMC 4nm FinFET |
| Cores/Threads | 4x Zen5, 8x Zen5c, 24 Threads |
4P+8E+4LPE, 16 threads |
4x Zen5, 4x Zen5c, 16 Threads |
4x Zen5, 8x Zen5c, 24 Threads |
| CPU Max Turbo | up to 5.2 GHz – Zen5, up to 3.3 GHz – Zen5c |
up to 4.9 GHz – P Cores, up to 3.9 GHz – E Cores, up to 3.5 GHz – LPE Cores |
up to 5.1 GHz – Zen5, up to 3.6 GHz – Zen5c |
up to 5.1 GHz – Zen5, up to 3.3 GHz – Zen5c |
| Cache | 36 MB | 18 MB | 24 MB | 34 MB |
| Memory |
DDR5-5600, LPDDR5x-8533, up to 256 GB |
LPDDR5x-8533, DDR5-7200, up to 128 GB |
DDR5-5600, LPDDR5x-8000, up to 128 GB |
DDR5-5600, LPDDR5x-8000, up to 128 GB |
| Graphics | Radeon 890M, 16x RDNA3.5 CUs, up to 3.1 GHz |
Intel Graphics, 4x Xe Cores, Panther Lake |
Radeon 890M, 8x RDNA3.5 CUs, up to 3.1 GHz |
Radeon 890M, 16x RDNA3.5 CUs, up to 2.9 GHz |
Most of these platforms are hybrid designs, a mix of higher-performance and higher-efficiency cores in various amounts. Intel takes the granularity even further, adding Low Power Efficiency Cores as well, and they show their value in battery use.
Furthermore, you’ll mostly find these platforms paired with external dGPUs, although there are a few exceptions that are built entirely on these Intel/AMD chips in the ultraportable segments. Those options run at lower power, though, and thus perform accordingly. We’ll touch on them in the article.
Finally, most notebooks built on this hardware ship with faster LPDDR5x memory (onboard, non-upgradable), though some mid-level designs offer upgradeable DDR5 in SO-DIMM slots. As for storage, the AMD hardware only offers PCIe 4.0 lanes, and thus only the Intel variants support the faster PCIe 5.0 SSDs.
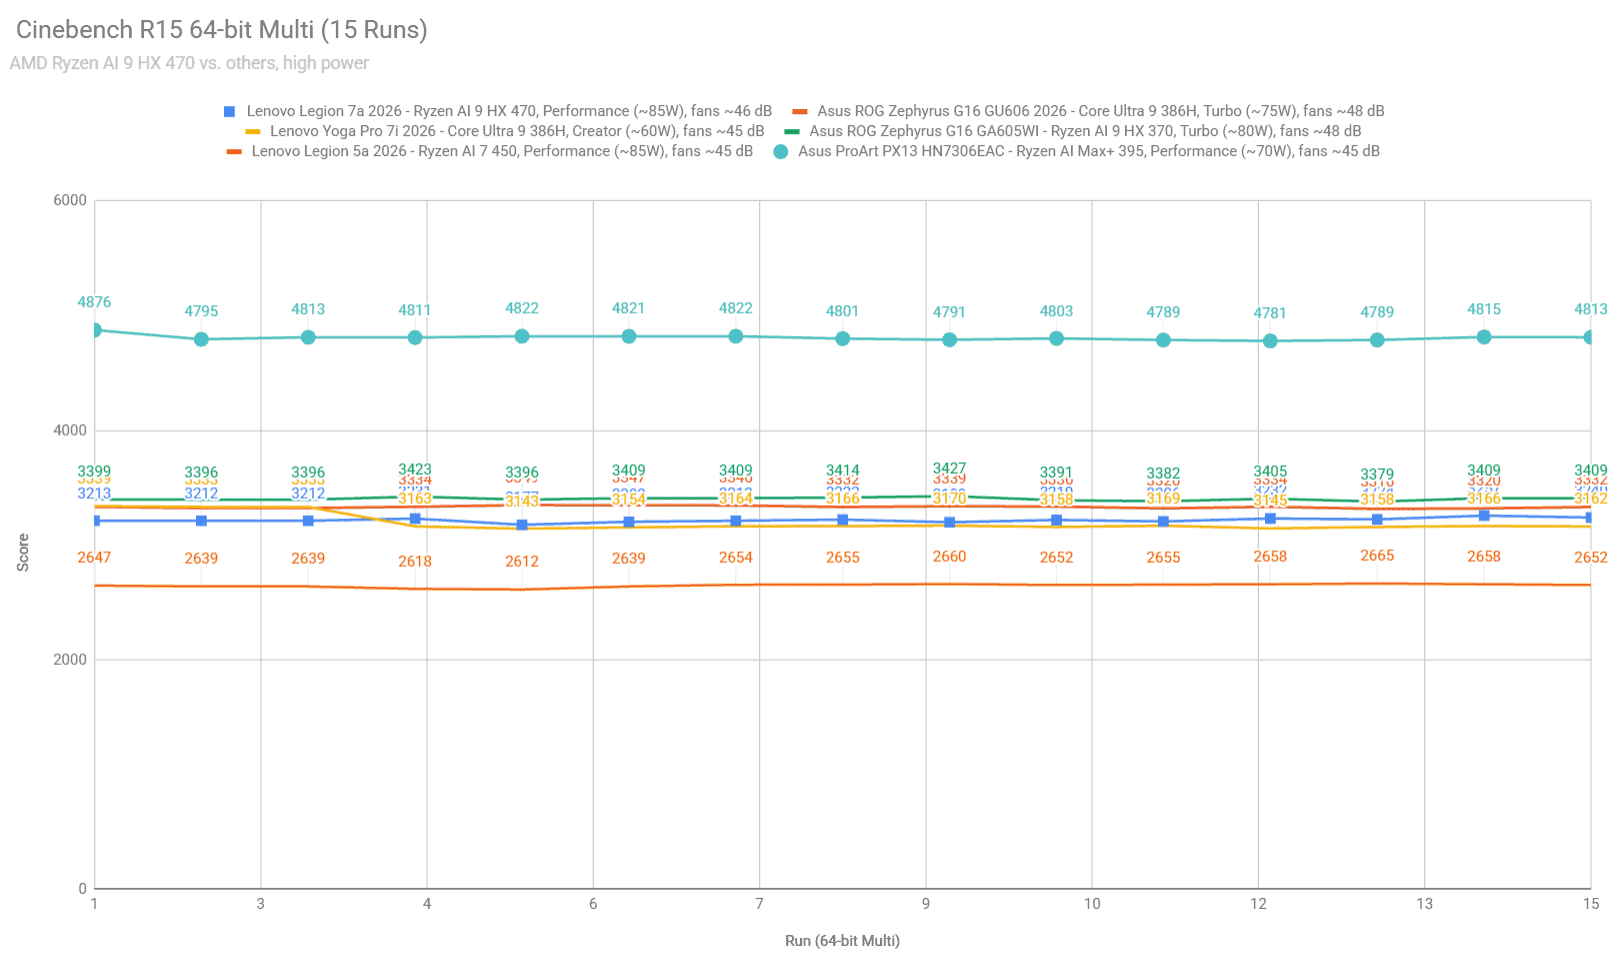
Sustained CPU Benchmarks – AMD Ryzen AI 9 HX 470 vs. Intel Core Ultra 9 386H
We’ll start with a look at these platforms’ sustained performance at higher power levels that maximize the hardware’s potential.
A few findings:
- for the most part, the AMD Ryzen AI 9 and the Intel Core Ultra 9 platforms perform within 5-10% of each other in this sustained CPU load, with a minimal advantage for the AMD hardware;
- there’s hardly any difference between the Ryzen AI 9 HX 470 and the Ryzen AI 9 HX 370;
- all these are only mid-level performers by today’s standards, where the more powerful platforms score at least 50% higher, including the Strix Halo Ryzen AI 9 Max+ 395 implemented in ultraportable designs;
- the Ryzen AI 7 450 comes at about 75% of the performance of the Ryzen 9 options, due to implementing fewer cores and threads;
- all these devices run loudly and hot on their higher-tier profiles and power levels, and we’re discussing alternatives down below.
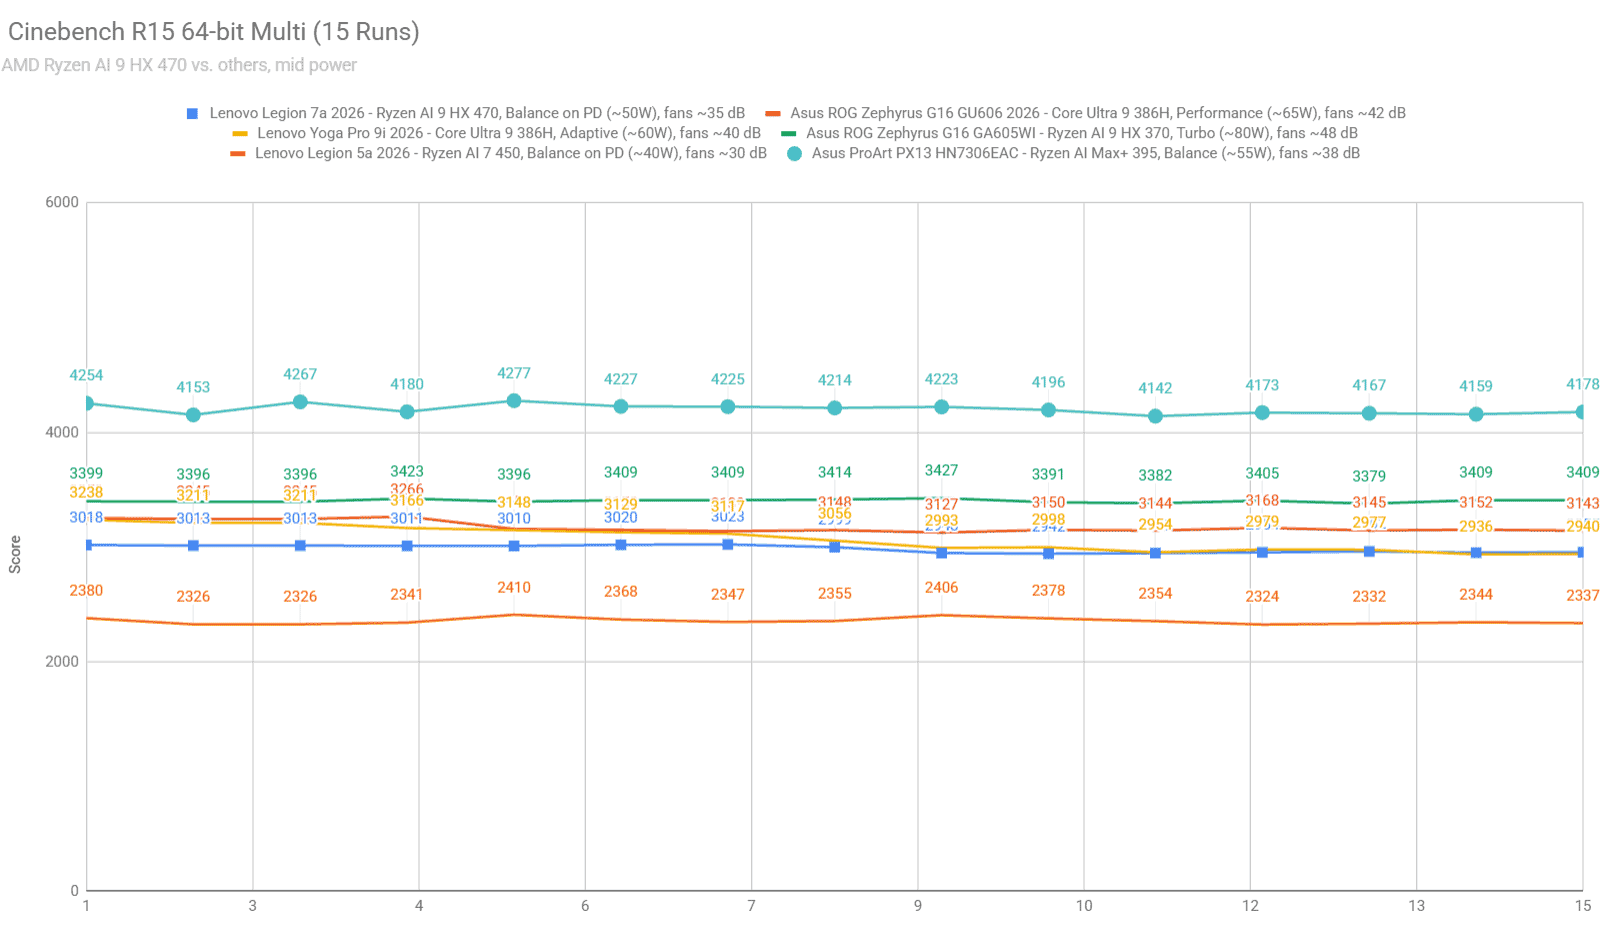
Here’s what to expect from these platforms at mid-level profiles and more acceptable noise levels. Furthermore, keep in mind the hardware generally runs at lower thermals as well at these levels.
At around the 50-60W power level, these platforms still deliver about 90% of their capabilities at higher power, with quieter fan noise and cooler internal temperatures.
At the same time, the drop in performance for the AMD Strix Halo Ryzen AI 9 Max+ chip is more significant, but that platform still beats the other options by a generous margin.
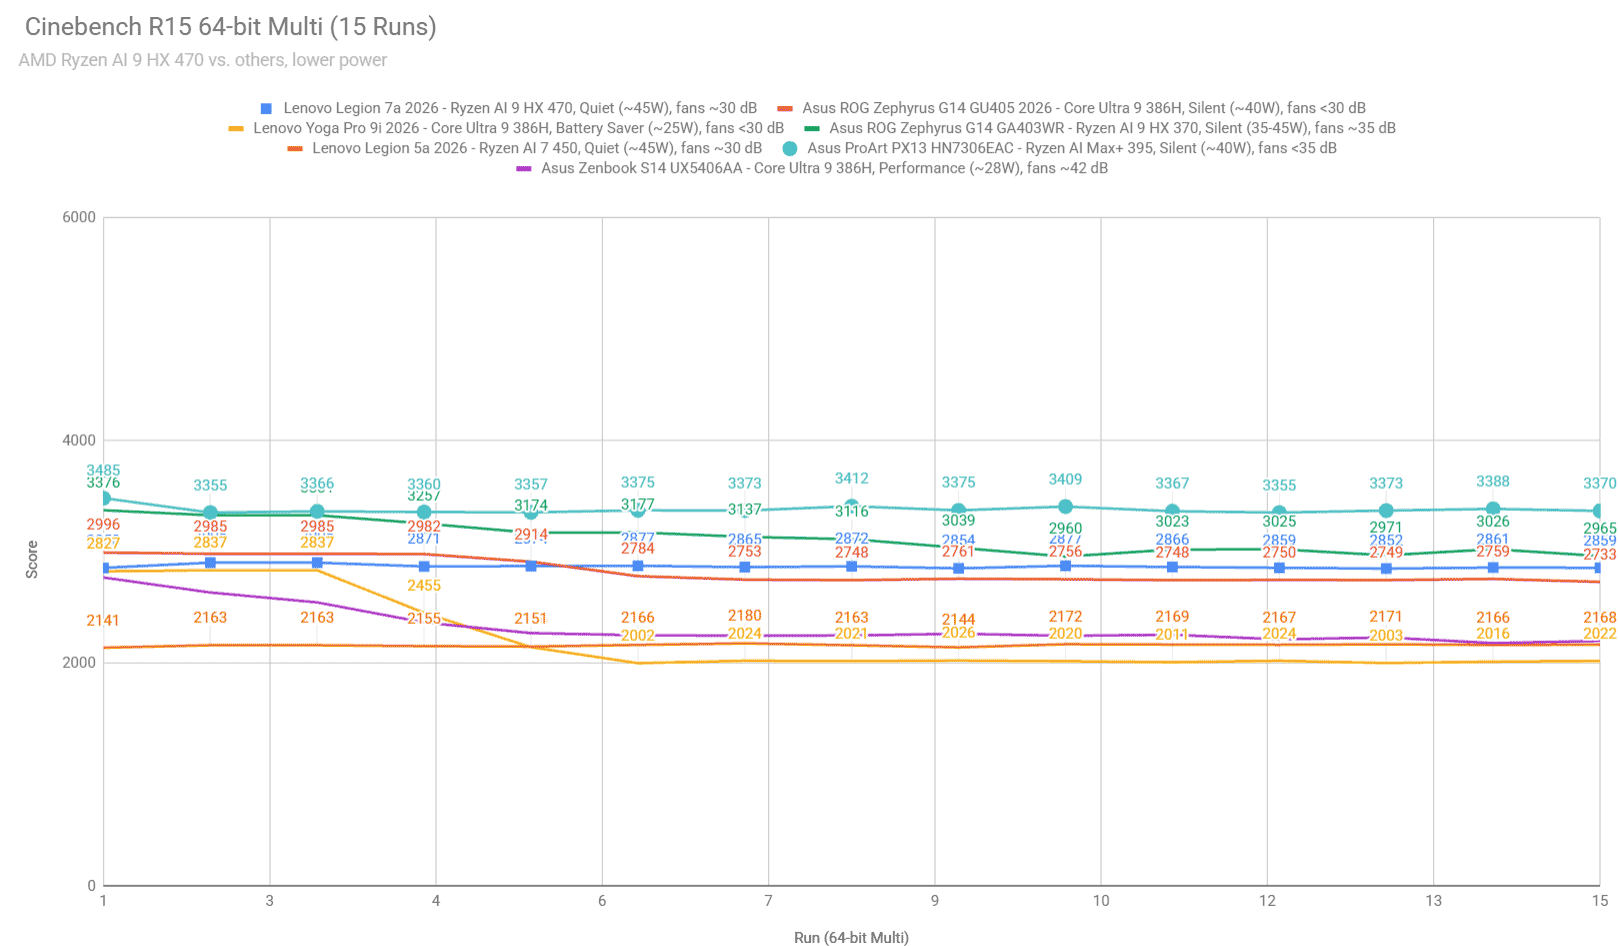
And here’s what to expect when pegging this hardware at lower power levels, which is either what you’re getting on the Silent/Quiet profiles for the devices mentioned so far, or what you can expect from ultraportable implementations of this hardware.
The AMD Gorgon Point and Intel Panther Lake chips still deliver about 70-80% of their max capabilities at these lower power levels, which is impressive and allows for still solid performance with quiet fan noise and comfortable thermals.
Even towards 25-30W, the Intel chip is still a decent performer at about 65% of max capabilities. That’s what you’re getting with the few ultraportable implementations of the hardware, such as the Asus Zenbook S14.
More CPU benchmarks
Let’s get to the standard CPU benchmarks in the following table.
Keep in mind we’re only discussing the CPU capabilities of each implementation, since the graphics performance varies between units, as each device bundles different GPUs.
| Legion 7a AMD Ryzen AI 9 HX 470, ~85W CPU |
Zephyrus G16 Intel Core Ultra 9 386H, ~75W |
Yoga Pro 9i Intel Core Ultra 9 386H, ~65W |
ProArt PX13 AMD Ryzen AI 9 Max+ 395, ~70W |
Zephyrus G16 AMD Ryzen AI 9 HX 370, ~80W |
Legion 5a AMD Ryzen AI 7 450, ~80W CPU |
|
| 3DMark – Fire Strike, Physics | 31587 | 29989 | 30419 | 31729 | 30854 | 29271 |
| 3DMark – Time Spy, Physics | 10905 | 15672 | 15503 | 10485 | 11042 | 10711 |
| CineBench R23 (best run) | 24113 cb – multi core, 2059 cb – single core |
21589 cb – multi core, 2127 cb – single core |
21166 cb – multi core, 2115 cb – single core |
20841 cb – multi core, 2029 cb – single core |
23719 cb – multi core, 2049 cb – single core |
18116 cb – multi core, 1972 cb – single core |
| CineBench 26 (10 min) | 5031 pts – multi threads, 482 pts – single thread |
4782 pts – multi threads, 521 pts – single thread |
4612 pts – multi threads, 502 pts – single thread |
6816 pts – multi threads, 464 pts – single thread |
– | 3681 pts – multi threads, 478 pts – single thread |
| Geekbench 6.6.0 | 15671 multi 2952 single |
17080 multi 2907 single |
16885 multi 2865 single |
18956 multi 2938 single |
15238 multi 2834 single |
13799 multi 2900 single |
| Blender 5.1.2 – Classroom scene – CPU Compute | 3m 45s | 4m 09s | 4m 24s | 2m 36s | 3m 53s | 4m 40s |
These scores further reflect how close the AMD Ryzen AI 9 HX 470 and the Intel Core Ultra 9 386H platforms are in general performance, with minor advantages for the AMD hardware in sustained multi-threaded loads and a similar minor advantage for the Intel platform in single-core scores.
However, the results tend to vary more significantly with specific workloads. For instance, in Blender, the AMD Ryzen 9 chip scores 15-20% higher than the Intel Panther Lake Core Ultra 9.
Most heavy workloads put more significant stress on the GPU, though, and for that I’ve added a few results from SpecViewPerf of the few RTX 5060 configurations we’ve tested, at either 90-100W TGP or 65-75W TGP. Hardly any difference between these platforms, including the device built on the slower Ryzen AI 7 chip.
| Legion 7a AMD Ryzen AI 9 HX 470, RTX 5060 95W TGP |
Legion 7a AMD Ryzen AI 9 HX 470, RTX 5060 75W TGP |
Yoga Pro 9i Intel Core Ultra 9 386H, RTX 5060 100W TGP |
Yoga Pro 9i Intel Core Ultra 9 386H, RTX 5060 65W TGP |
Legion 5a AMD Ryzen AI 7 450, RTX 5060 105W TGP |
Legion 5a AMD Ryzen AI 7 450, RTX 5060 75W TGP |
|
| 3DMark – Fire Strike, Graphics | 31076 | 27979 | 31340 | 27476 | 31722 | 28977 |
| 3DMark – Time Spy, Graphics | 11499 | 10053 | 11829 | 10340 | 12650 | 10842 |
| SPECviewperf 2020 – 3DSMax 07 | 106.98 | 100.90 | 108.37 | 110.12 | 108.52 | 102.96 |
| SPECviewperf 2020 – Maya 06 | 406.04 | 388.10 | 400.80 | 397.34 | 411.38 | 390.75 |
| SPECviewperf 2020 – SW 07 | 256.60 | 240.13 | 247.22 | 242.39 | 257.38 | 243.88 |
Gaming capabilities
We’re going back to the same AMD/Intel + RTX 5060 configurations for a few gaming tests.
However, take these results with a big lump of salt, since there are notable design differences between the Legions and the Yogas that favor the former: the existence of a MUX and better cooling.
I haven’t tested a comparable Core Ultra 9 + RTX 5060 with a MUX device for a more accurate comparison; hence, the results in the following table can be misleading and lead you to the wrong conclusions. In real-life and in comparable implementations, there shouldn’t be a notable difference in framerates between the Ryzen AI 9 and the Core Ultra 9 platforms.
| 2.5K resolution, Ultra settings |
Legion 7a AMD Ryzen AI 9 HX 470, RTX 5060 95W TGP |
Legion 7a AMD Ryzen AI 9 HX 470, RTX 5060 75W TGP |
Yoga Pro 9i Intel Core Ultra 9 386H, RTX 5060 100W TGP |
Yoga Pro 9i Intel Core Ultra 9 386H, RTX 5060 65W TGP |
Legion 5a AMD Ryzen AI 7 450, RTX 5060 105W TGP |
Legion 5a AMD Ryzen AI 7 450, RTX 5060 75W TGP |
| Black Myth: Wukong (DX 12, Cinematic Preset, RT ON Very High) DLSS 4.0 – DLSS 55 Balanced, MFG On 2x |
46 fps (32 fps – 1% low) | 40 fps (26 fps – 1% low) | 40 fps (12 fps – 1% low) | 36 fps (8 fps – 1% low) | 40 fps (14 fps – 1% low) | 34 fps (12 fps – 1% low) |
| Cyberpunk 2077 (DX 12, Ultra Preset, RT On Overdrive) DLSS 4.0 – DLSS Balanced, MFG On 2x, Ray Reconstruction On, Path Tracing On |
58 fps (26 fps – 1% low) | 53 fps (22 fps – 1% low) | 56 fps (46 fps – 1% low) | 48 fps (40 fps – 1% low) | 62 fps (26 fps – 1% low) | 54 fps (24 fps – 1% low) |
| Horizon Forbidden West (DX 12, Very High Preset, DLAA, DLSS 3.0 Balanced, FG On) |
95 fps (75 fps – 1% low) | 80 fps (49 fps – 1% low) | 84 fps (70 fps – 1% low) | 78 fps (65 fps – 1% low) | 102 fps (88 fps – 1% low) | 90 fps (74 fps – 1% low) |
| Red Dead Redemption 2 (DX 12, Ultra Optimized, TAA) |
81 fps (58 fps – 1% low) | 74 fps (52 fps – 1% low) | 59 fps (38 fps – 1% low) | 54 fps (34 fps – 1% low) | 78 fps (60 fps – 1% low) | 73 fps (58 fps – 1% low) |
Efficiency and Battery Power
Here are some battery life results on these tested devices. We’re looking at the average power draw with each platform, as the actual runtimes can differ based on the battery size, which varies somewhat between units.
The gains in efficiency are significant for the 2026 Intel and AMD platforms compared to their predecessors.
The Core Ultra 9 386H Panther Lake chip has an edge in general multitasking and video streaming over all the AMD options, but even the Gorgon Point AMD Ryzen AI 9 and AI 7 chips still run way more efficiently than the past Strix Point implementations.
AMD Ryzen AI 9 HX 470 – Legion 7a
- 10-12 W – text editing in Google Drive, Quiet Mode, screen at 50%, Wi-Fi ON;
- 9-10 W – Netflix fullscreen in Edge, Quiet Mode, screen at 50%, Wi-Fi ON;
- 12-20 W – browsing in Edge, Quiet Mode, screen at 50%, Wi-Fi ON;
Intel Core Ultra 9 386H – Lenovo Yoga Pro 9i
- 8-10 W – text editing in Google Drive, Battery Saver Mode, screen at 40%, Wi-Fi ON;
- 6.5-7 W – Netflix fullscreen in Edge, Battery Saver Mode, screen at 40%, Wi-Fi ON;
- 10-12 W – browsing in Edge, Adaptive Mode, screen at 40%, Wi-Fi ON.
Intel Core Ultra 9 386H – Lenovo Yoga Pro 7i
- 8-10 W – text editing in Google Drive, Battery Saver Mode, screen at 40%, Wi-Fi ON;
- 6.5-7 W – Netflix fullscreen in Edge, Battery Saver Mode, screen at 40%, Wi-Fi ON;
- 9-12 W – browsing in Edge, Adaptive Mode, screen at 40%, Wi-Fi ON.
Intel Core Ultra 9 386H – Asus ROG Zephyrus G16
- 8-11 W – text editing in Google Drive, Silent Mode, screen at 50%, WiFi ON;
- 6-7 W – Netflix 4K HDR fullscreen in Edge, Silent Mode, screen at 50%, WiFi ON;
- 9-13 W – browsing in Edge, Silent Mode, screen at 50%, WiFi ON.
AMD Ryzen AI 9 370 – Asus ROG Zephyrus G16
- 14 W – text editing in Google Drive, Whisper Mode, screen at 50%, WiFi ON;
- 14 W – Netflix 4K HDR fullscreen in Edge, Whisper Mode, screen at 50%, WiFi ON;
- 16-20 W – browsing in Edge, Whisper Mode, screen at 50%, WiFi ON;
AMD Ryzen AI 9 370 – Asus ROG Zephyrus G14
- 12 W – text editing in Google Drive, Whisper Mode, screen at 50%, WiFi ON;
- 15 W – Netflix 4K HDR fullscreen in Edge, Whisper Mode, screen at 50%, WiFi ON;
- 16-18 W – browsing in Edge, Whisper Mode, screen at 50%, WiFi ON;
AMD Ryzen AI 7 450 – Legion 5a
- 10 W – text editing in Google Drive, Quiet Mode, screen at 50%, Wi-Fi ON;
- 10 W – Netflix fullscreen in Edge, Quiet Mode, screen at 50%, Wi-Fi ON;
- 12-20 W – browsing in Edge, Quiet Mode, screen at 50%, Wi-Fi ON;
Conclusions
All in all, both the AMD Ryzen AI 9 HX 470 and the Intel Core Ultra 9 386H are compelling mobile platforms, and you won’t go wrong with any of them.
Sure, some minor differences would favor one side over the other, with the most notable one being the improved efficiency of the Panther Lake hardware, which translates into slightly lower thermals and longer battery life in general use, but the 2026 AMD Gorgon Point options are not trailing the Intel hardware by that much.
At the same time, though, Intel hardware is generally implemented in higher-tier and more expensive products, while the AMD Ryzen AI 9 can be found in more affordable mid-tier devices, and that can make a difference for many of you, especially when considering 2026 prices for Windows laptops. Furthermore, if battery life is not that important for you, I’d still go with an AMD Strix Point device from last year, which offers similar and even better performance than the 2026 updates, for potentially a fraction of the cost.